

Money Market Brief
www.concoda.com
Money Market Brief
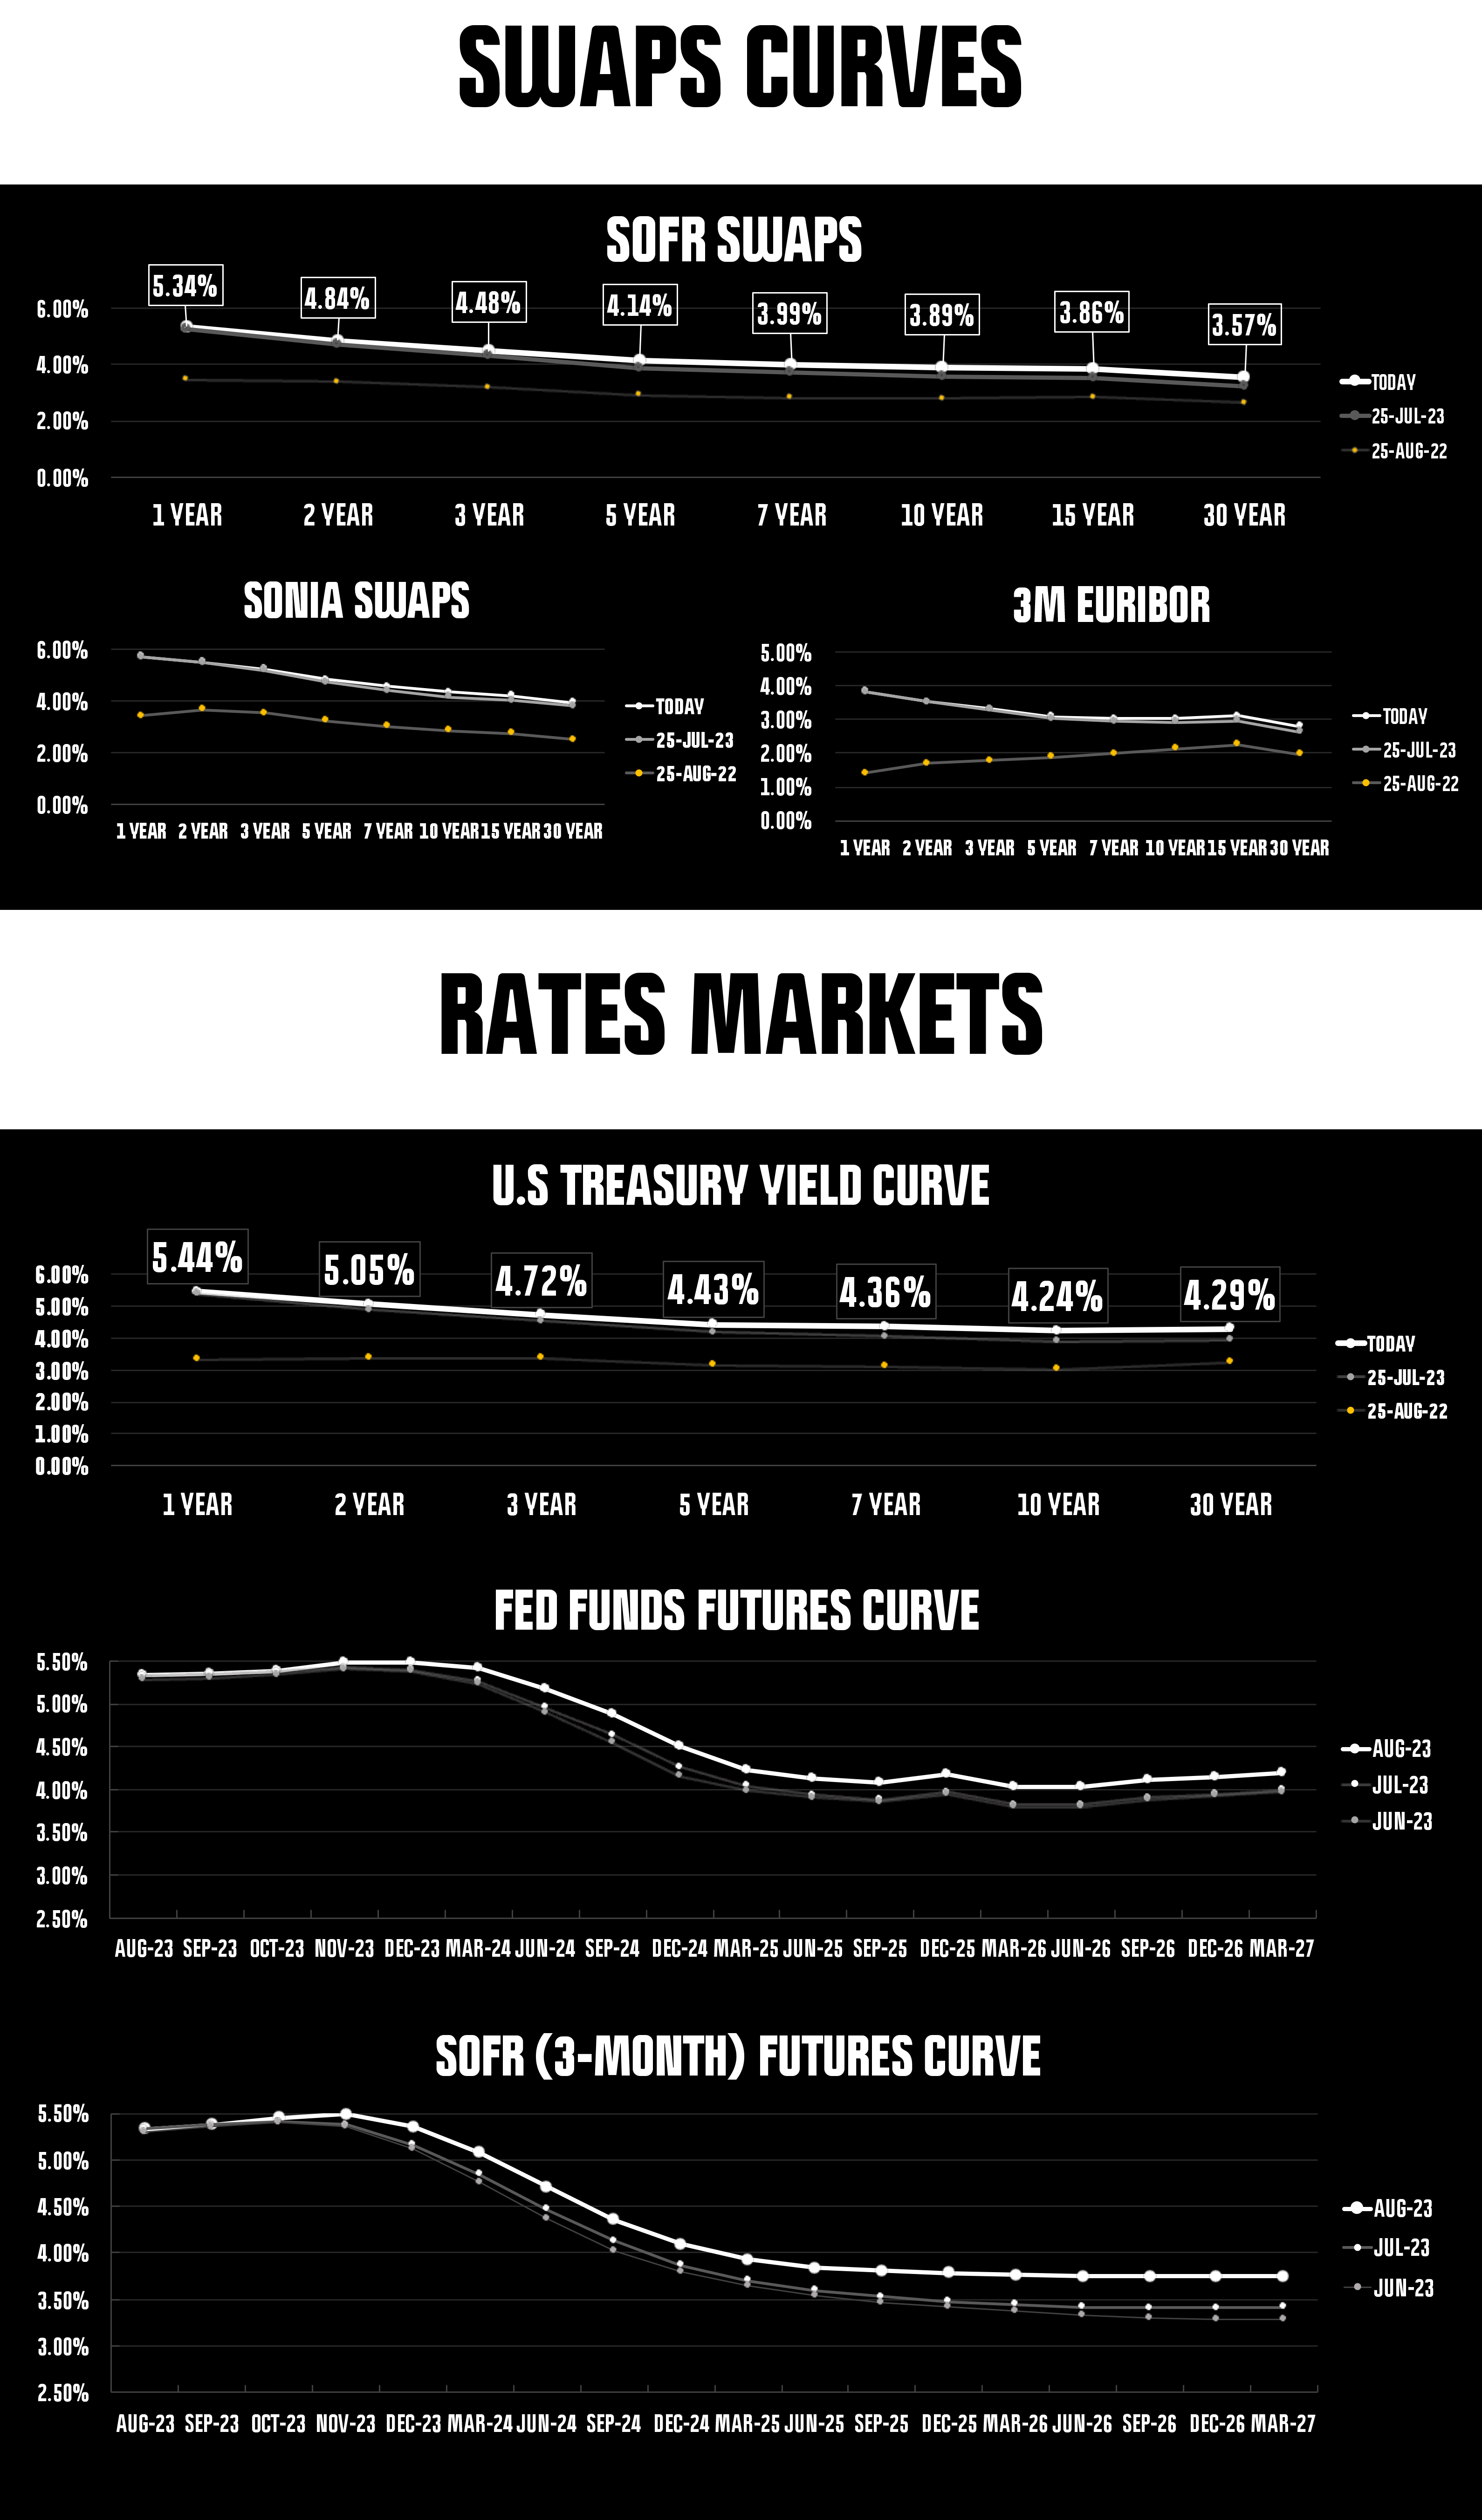
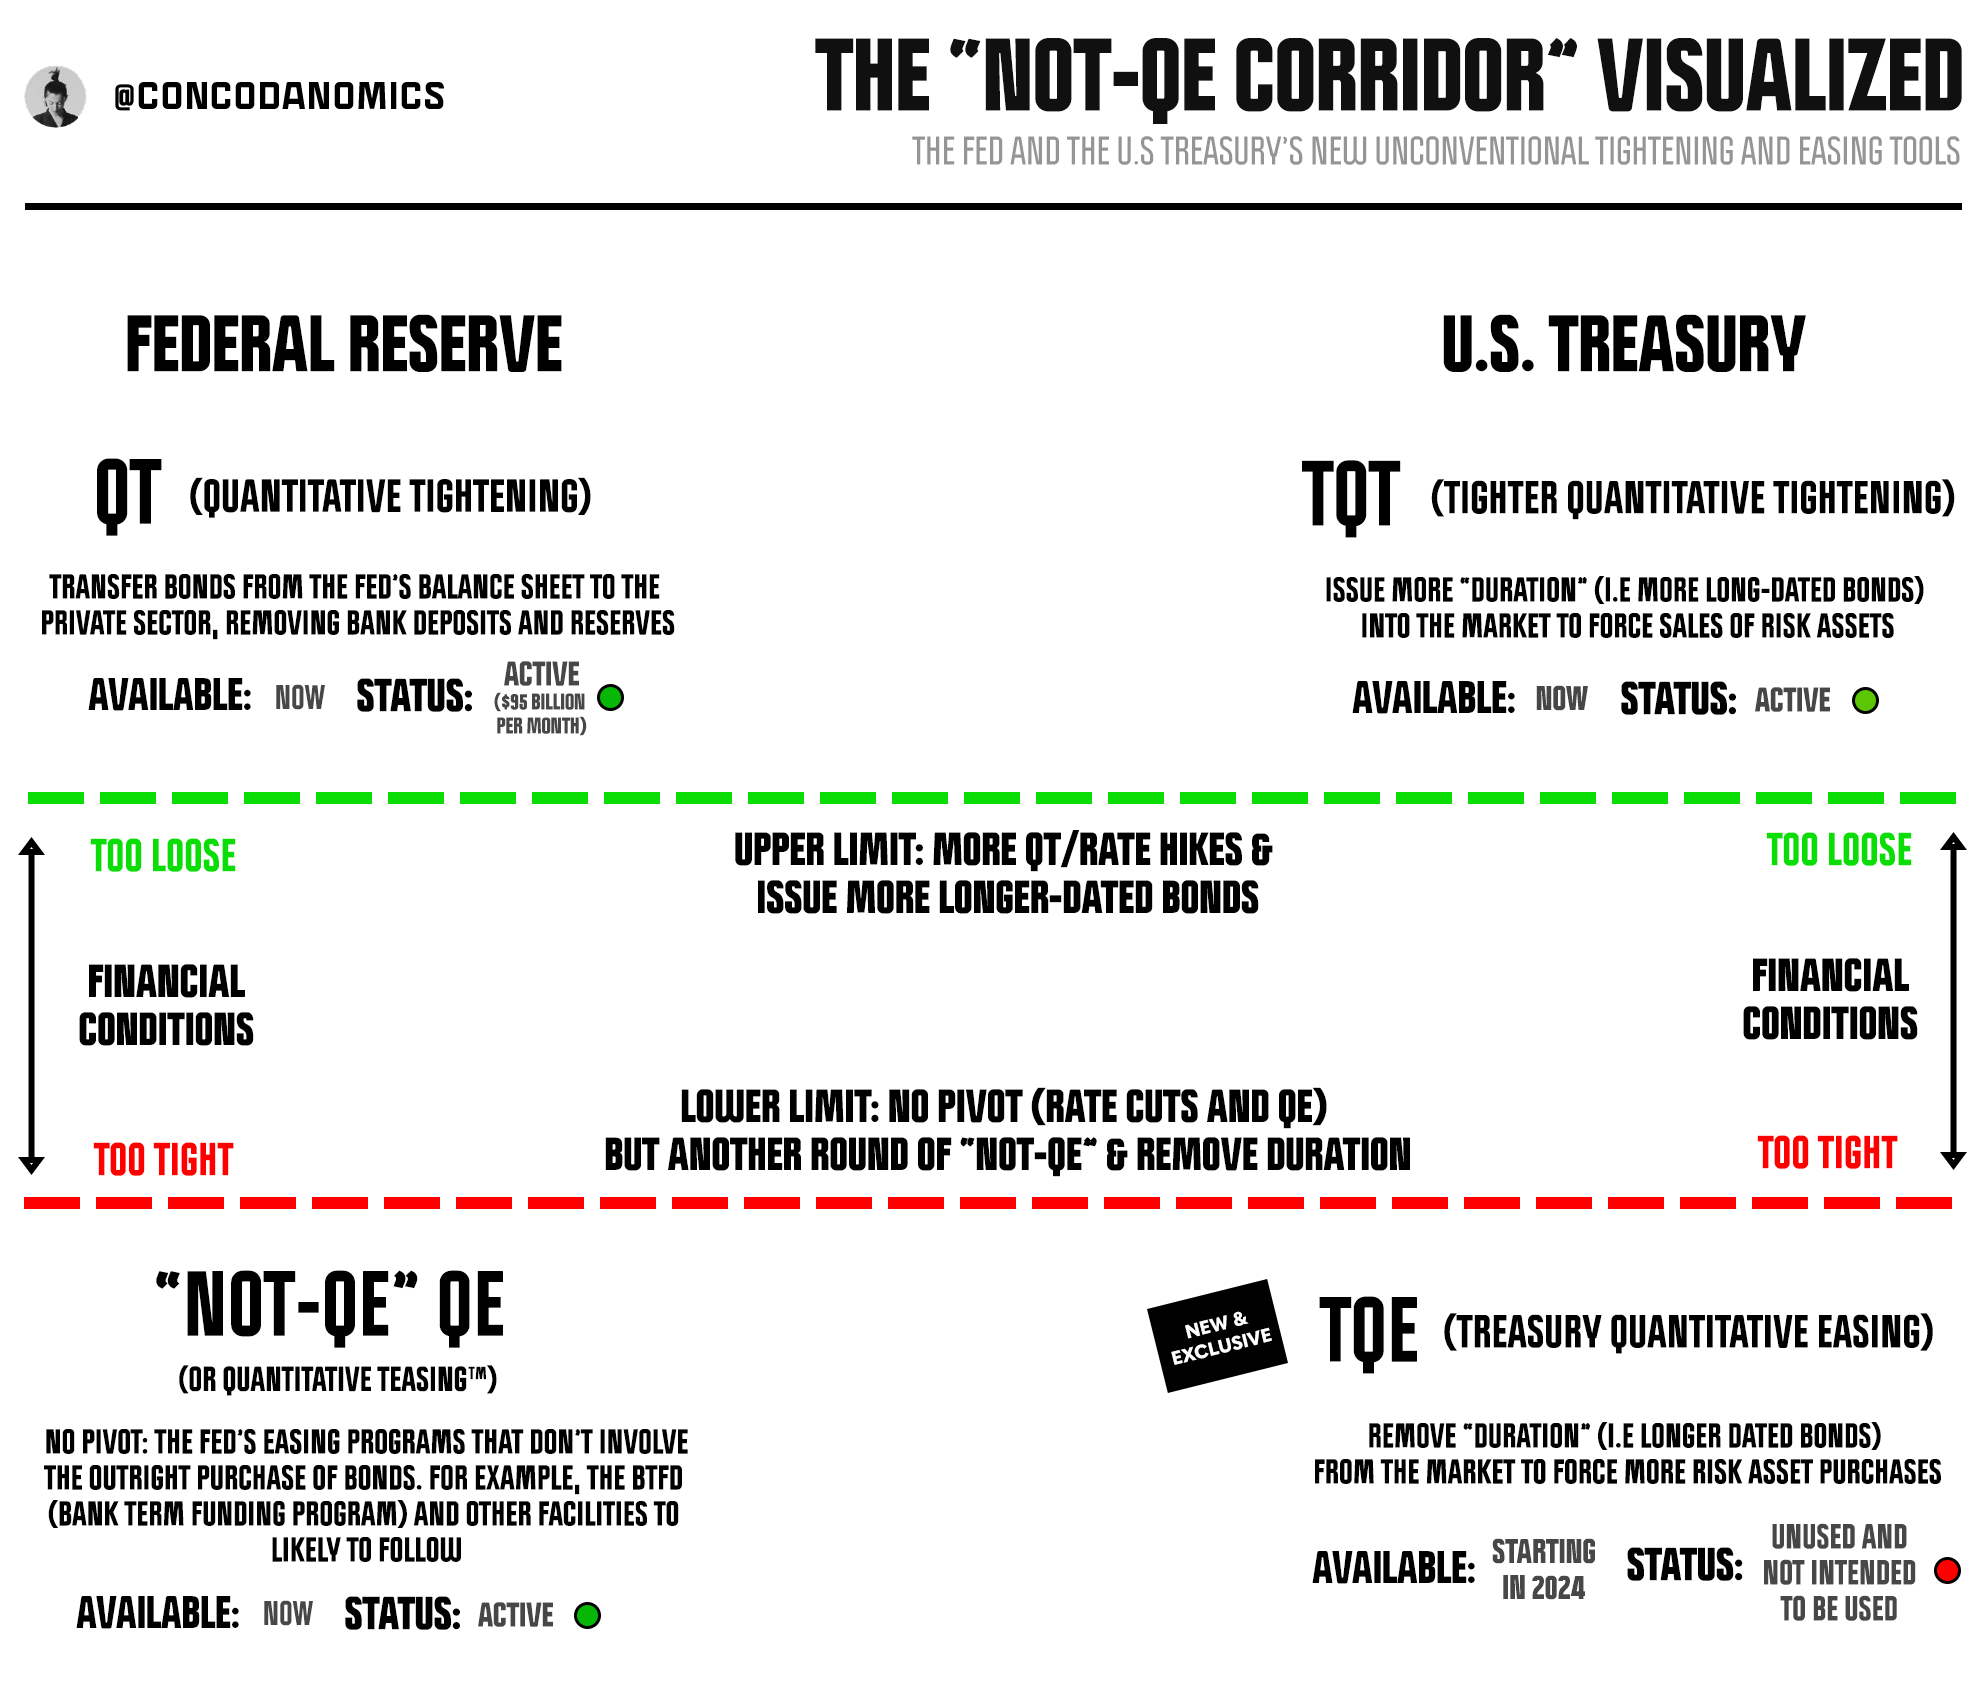
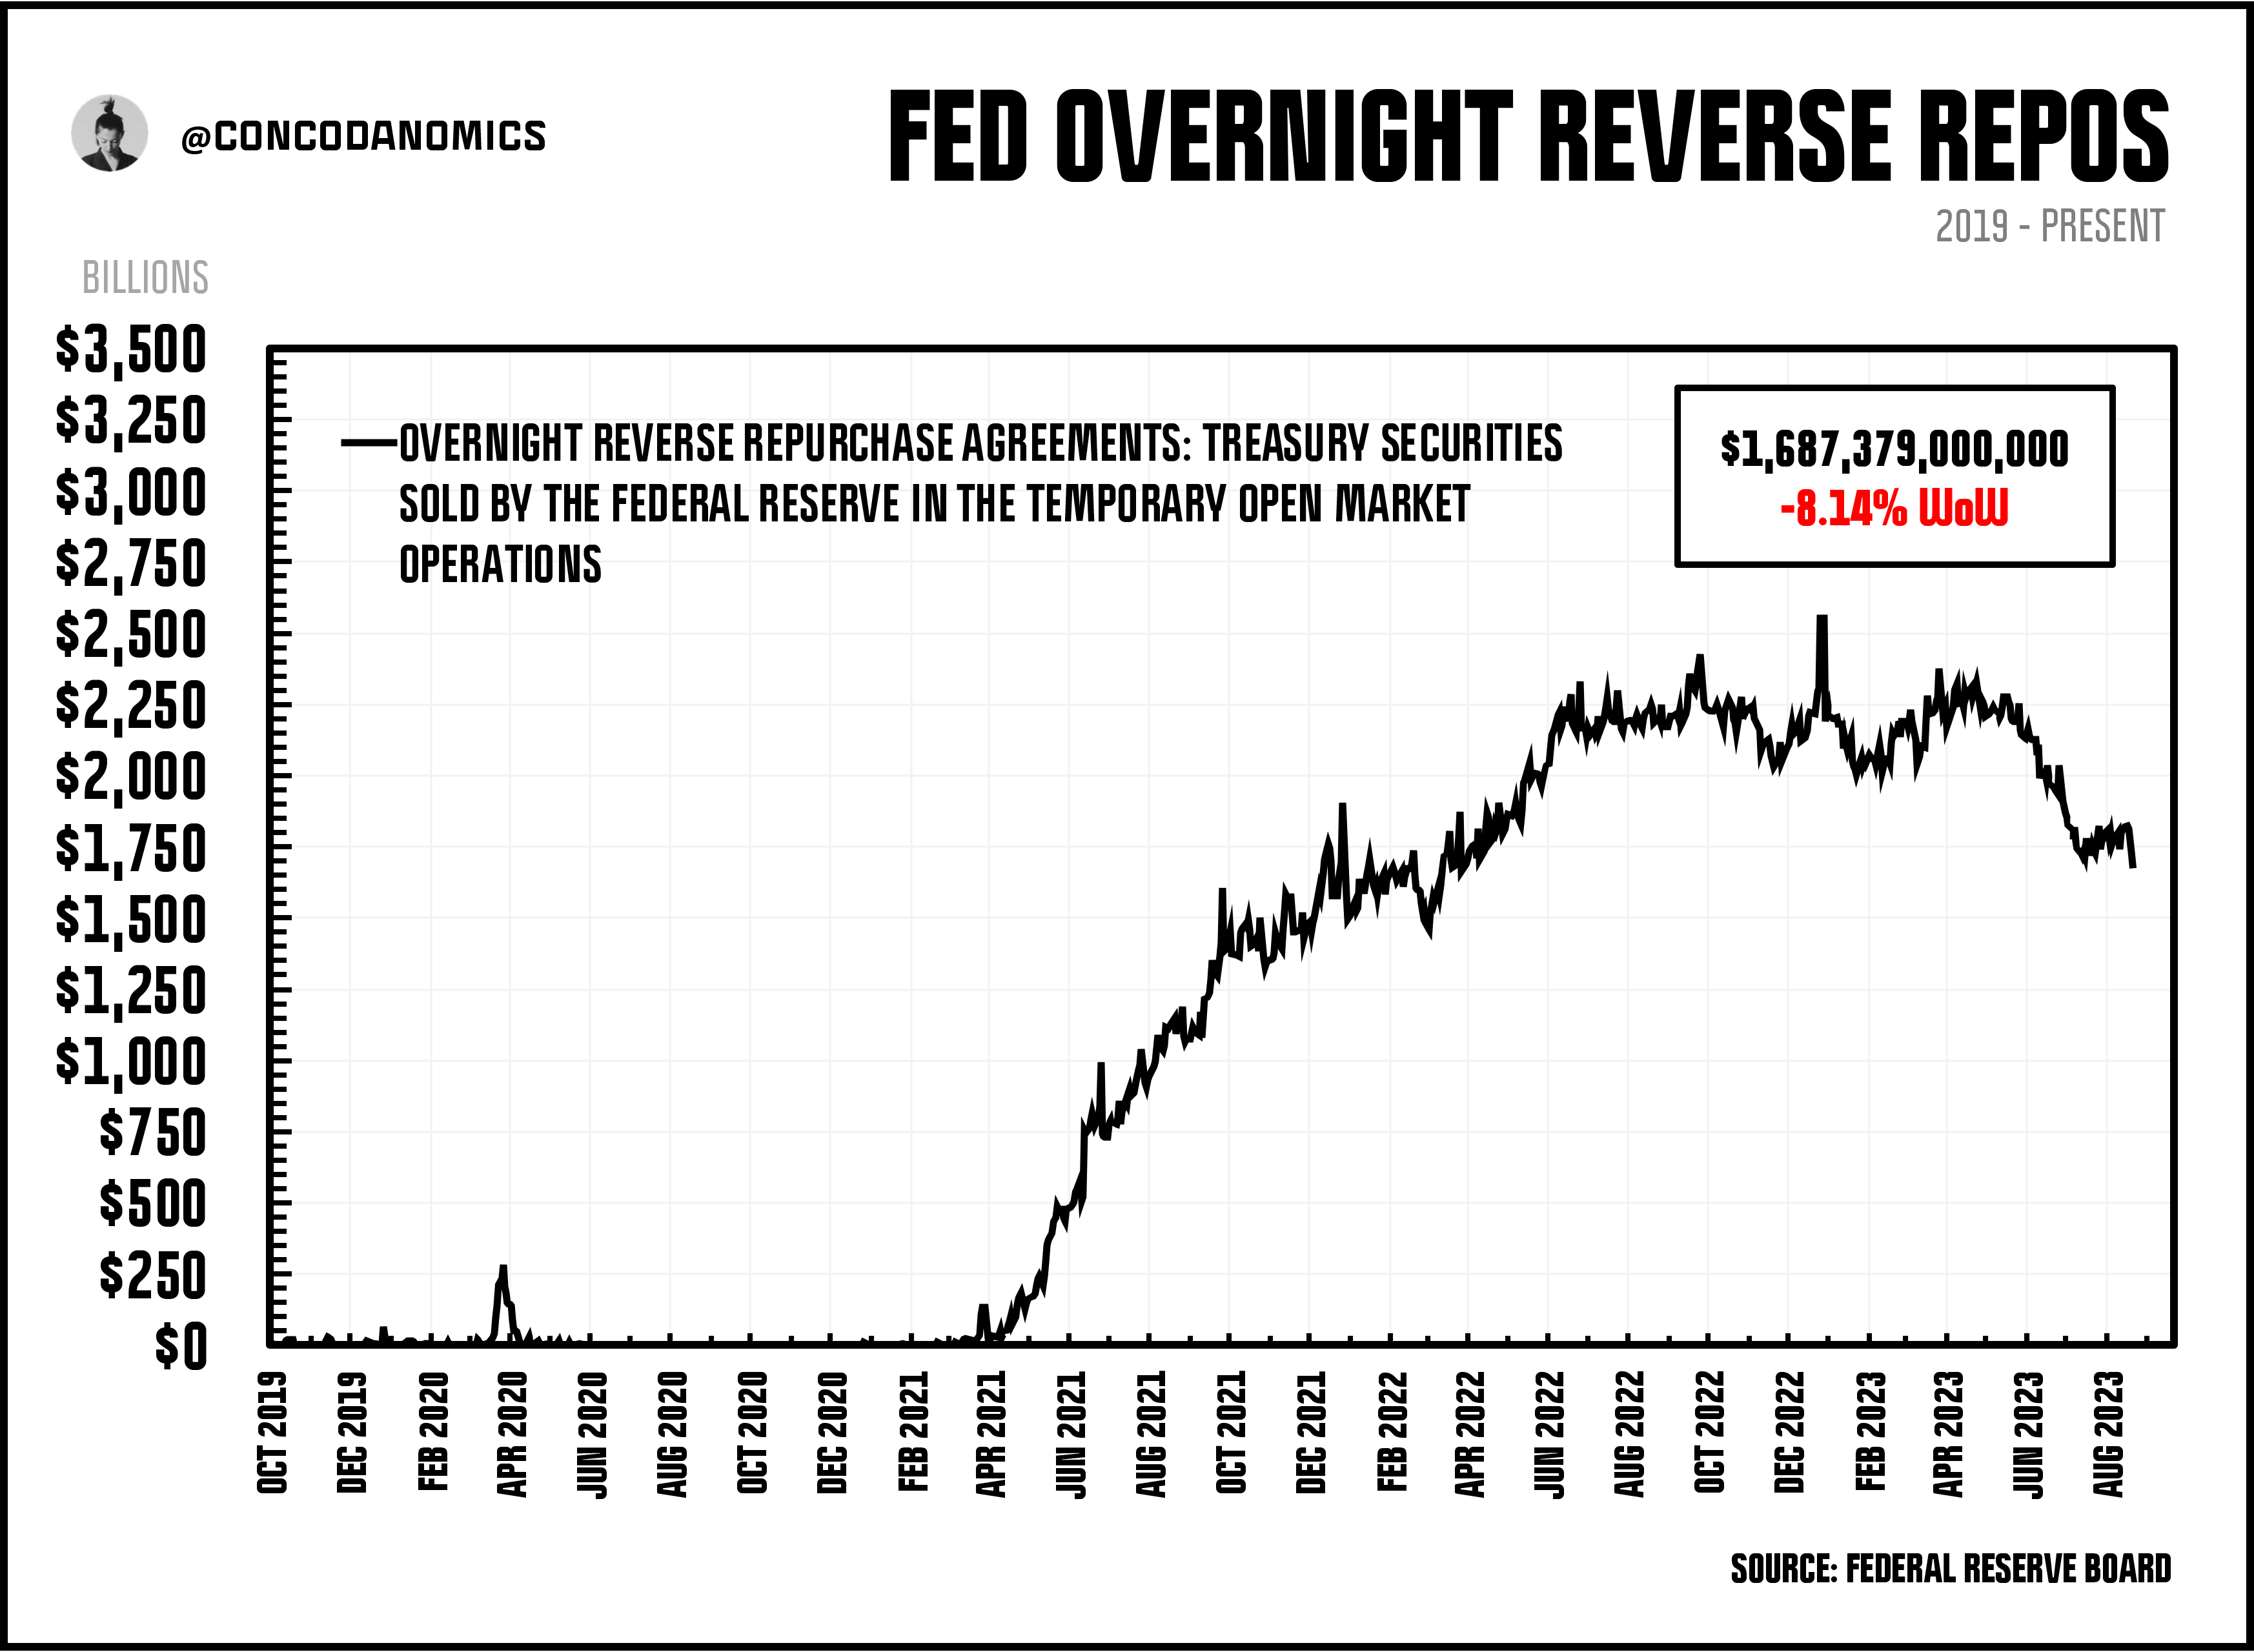
positive signs emerge: frontrunning of TQT (see below) is overdone, as bond vol and the RRP decline. A hawkish Fed (talk of 50bps hikes, not 25) is now the catalyst to turn the Great Chop™ into a drop

In case you missed it — or you’ve just joined us — the latest of our primers, The Rise of the Secured Standard, went live earlier this week:

In our next subscriber primer, we’ll demystify the interbank FX markets. Before that, our forthcoming piece will look at the latest developments in the war against megabanks and their risk-taking abilities. But first, a money market brief…
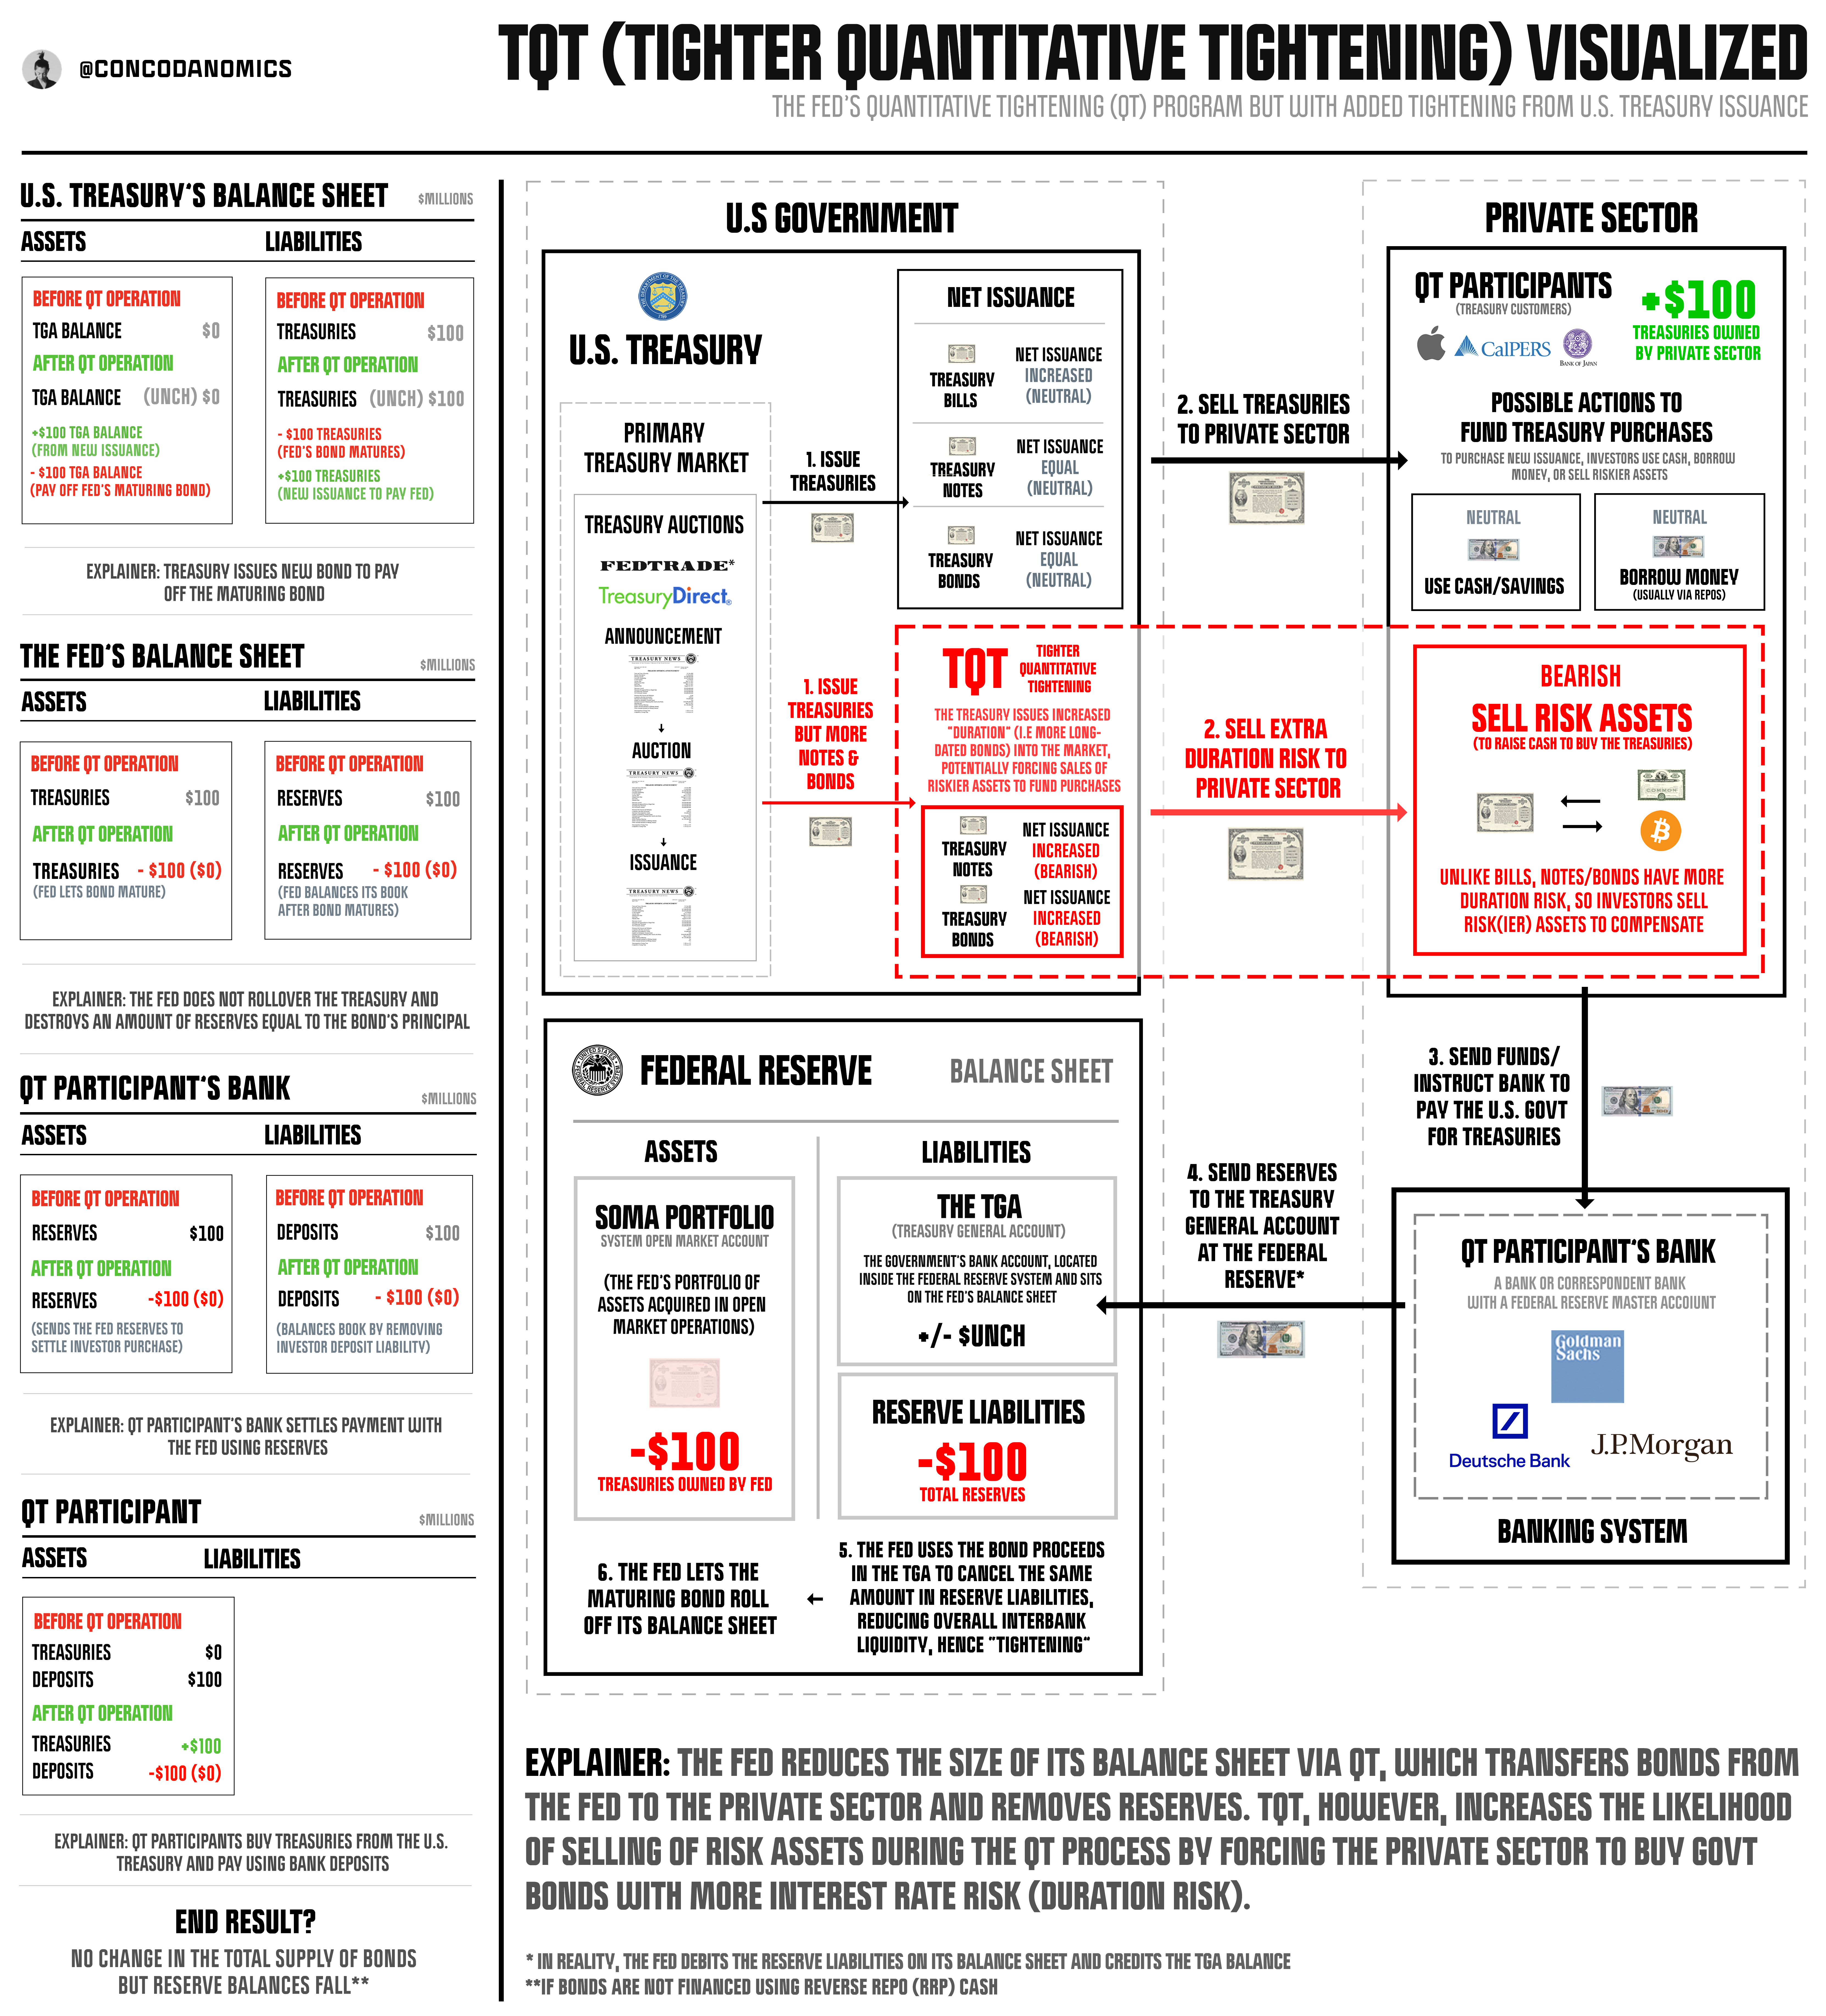
(the below article details TQT and the Great Chop in more detail…)


love the visualizations. great tool in combo with text and step by step explanations smart. thx a lot.
Hey, thanks for all the great content. Being a young investor, very eager to learn, your writings have been so fundamental for my understanding of money flows.
Could you please explain the following two in a nutshell? Thanks in advance!
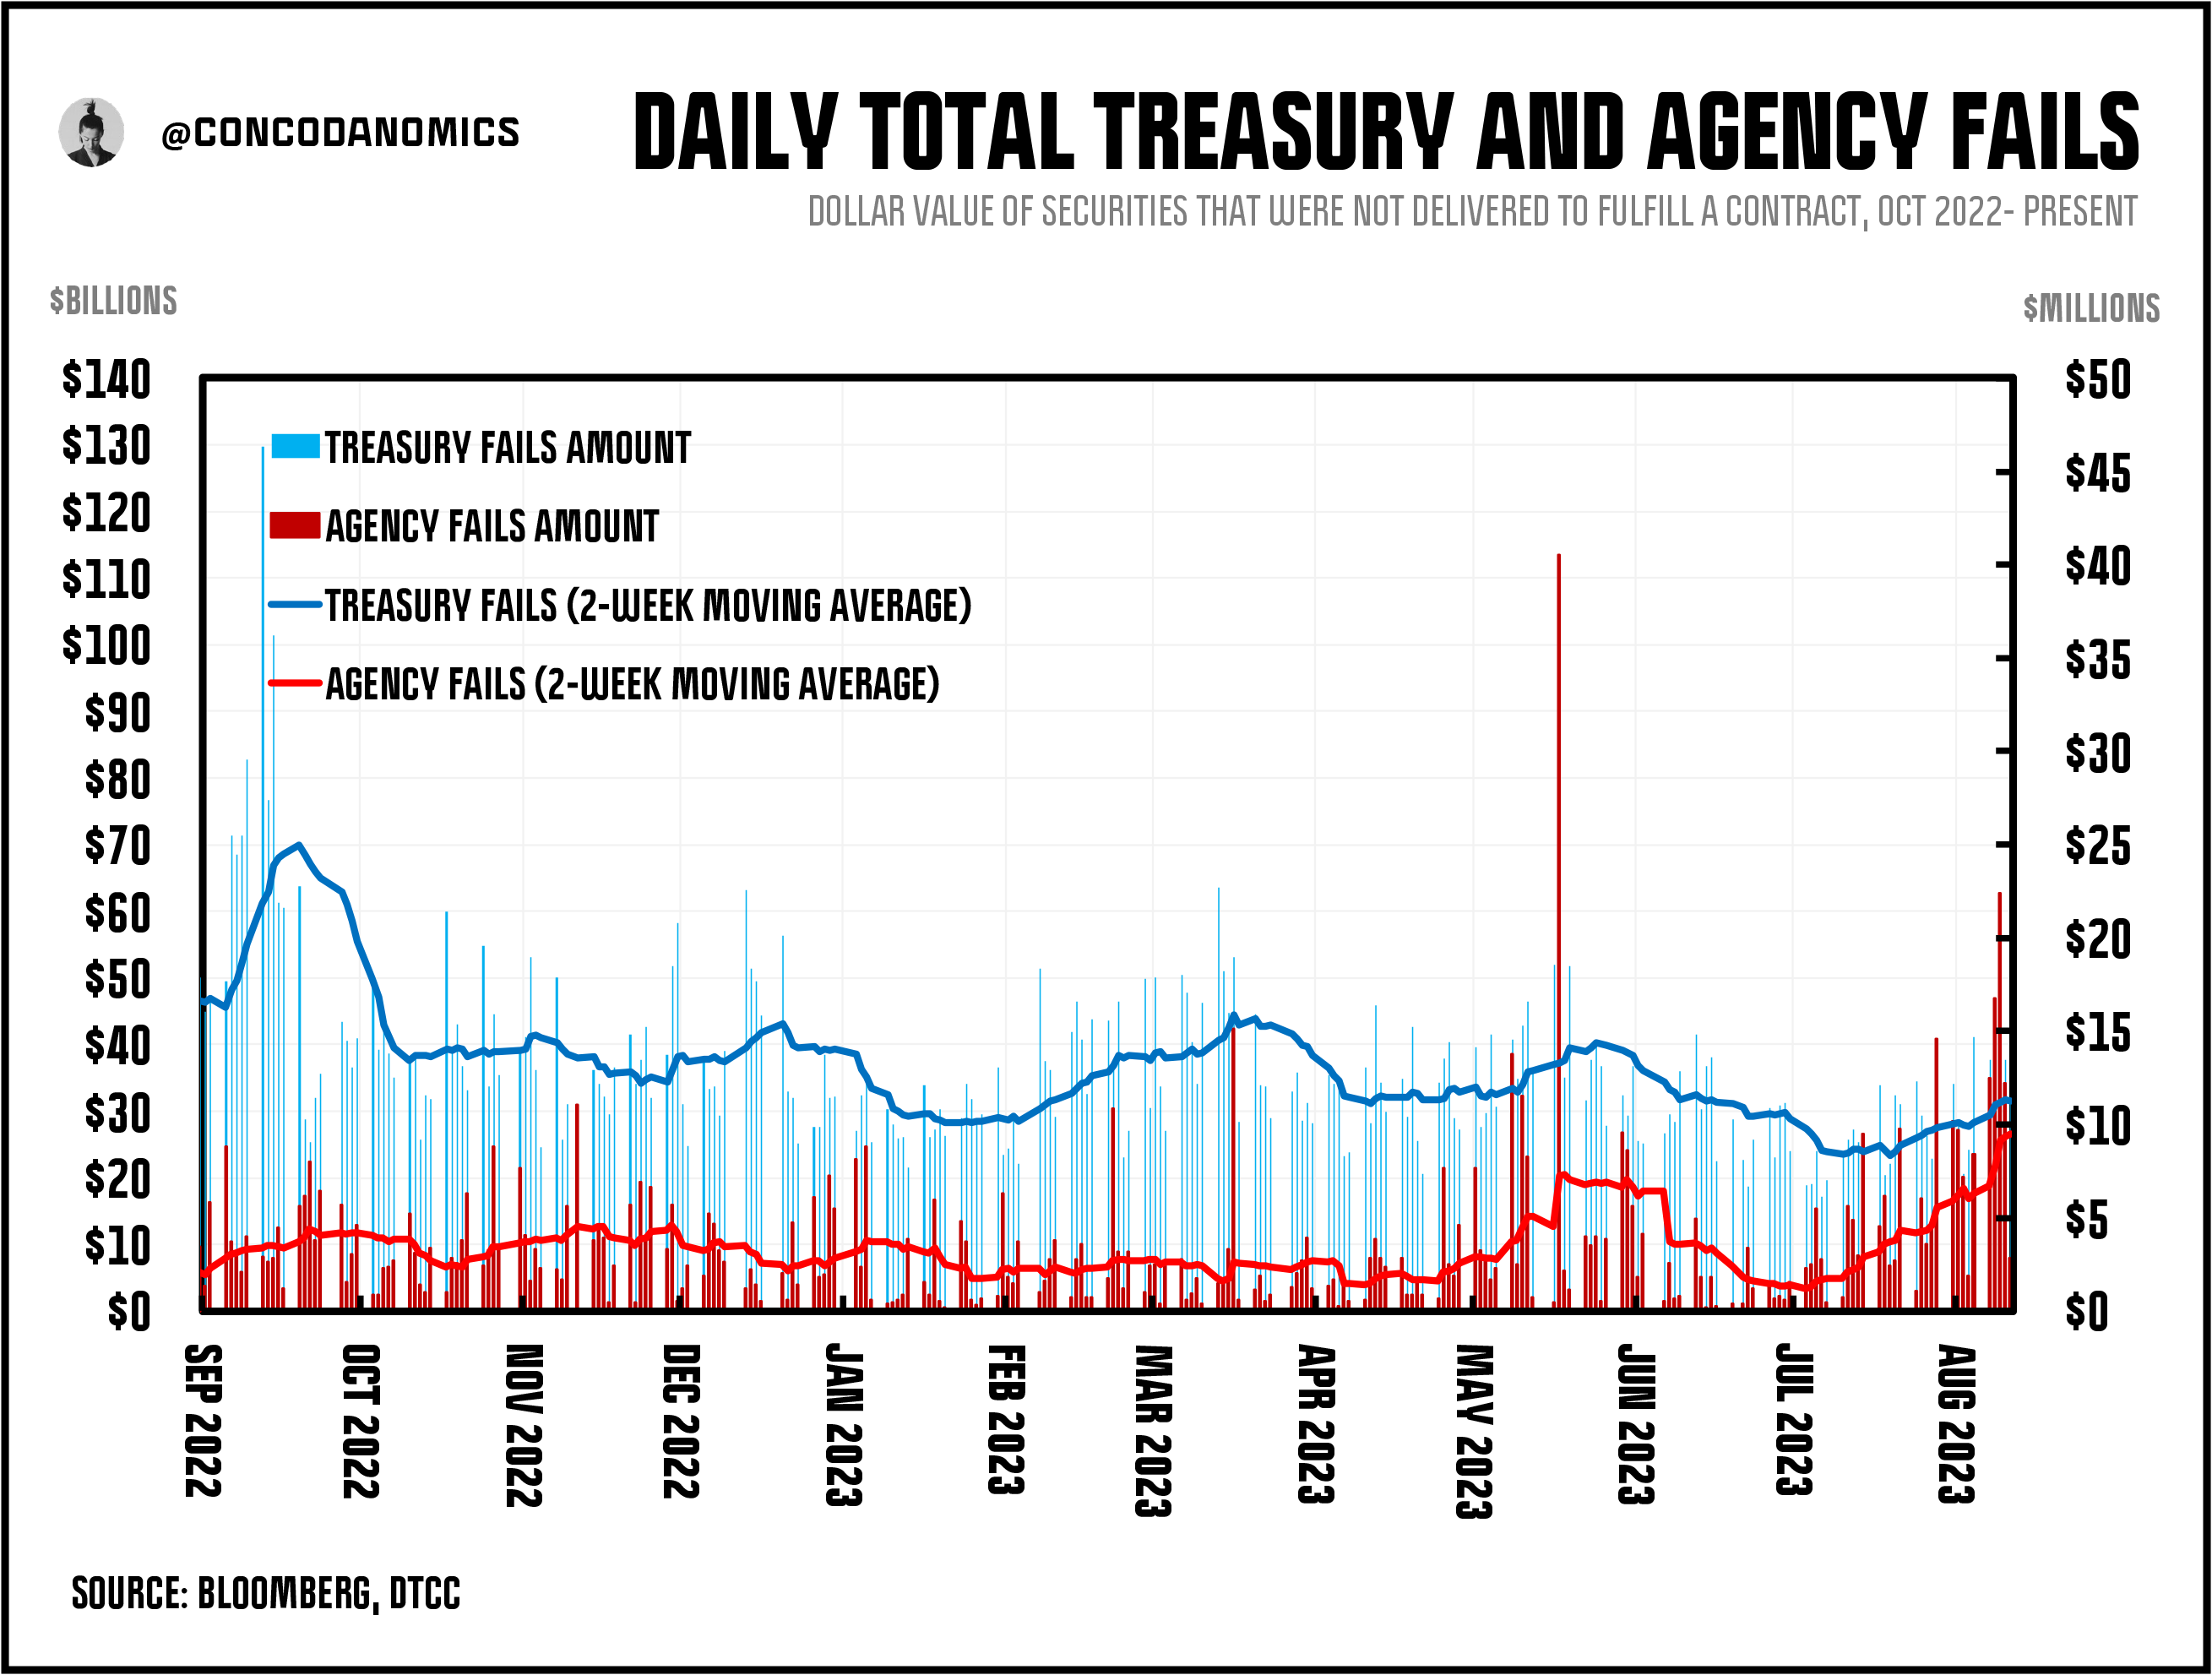
a) Treasury and Agency fails. Is this a metric that can be used, in conjunction with other indicators, to understand what is the collective liquidity in the system? The way I interpret it is that an increase over a certain threshold, and remaining at that level, implies that the failure to deliver USTs as part of agreed trades between market participants has increased. Such trades could be (Reverse) Repurchase Agreementssuch as Bilateral Trades,Bilateral Cleared Trades, General Collateral Trades etc. Could you please point out if my understanding is fundamentally incorrect and also, what does "Agency" represent in the graph?
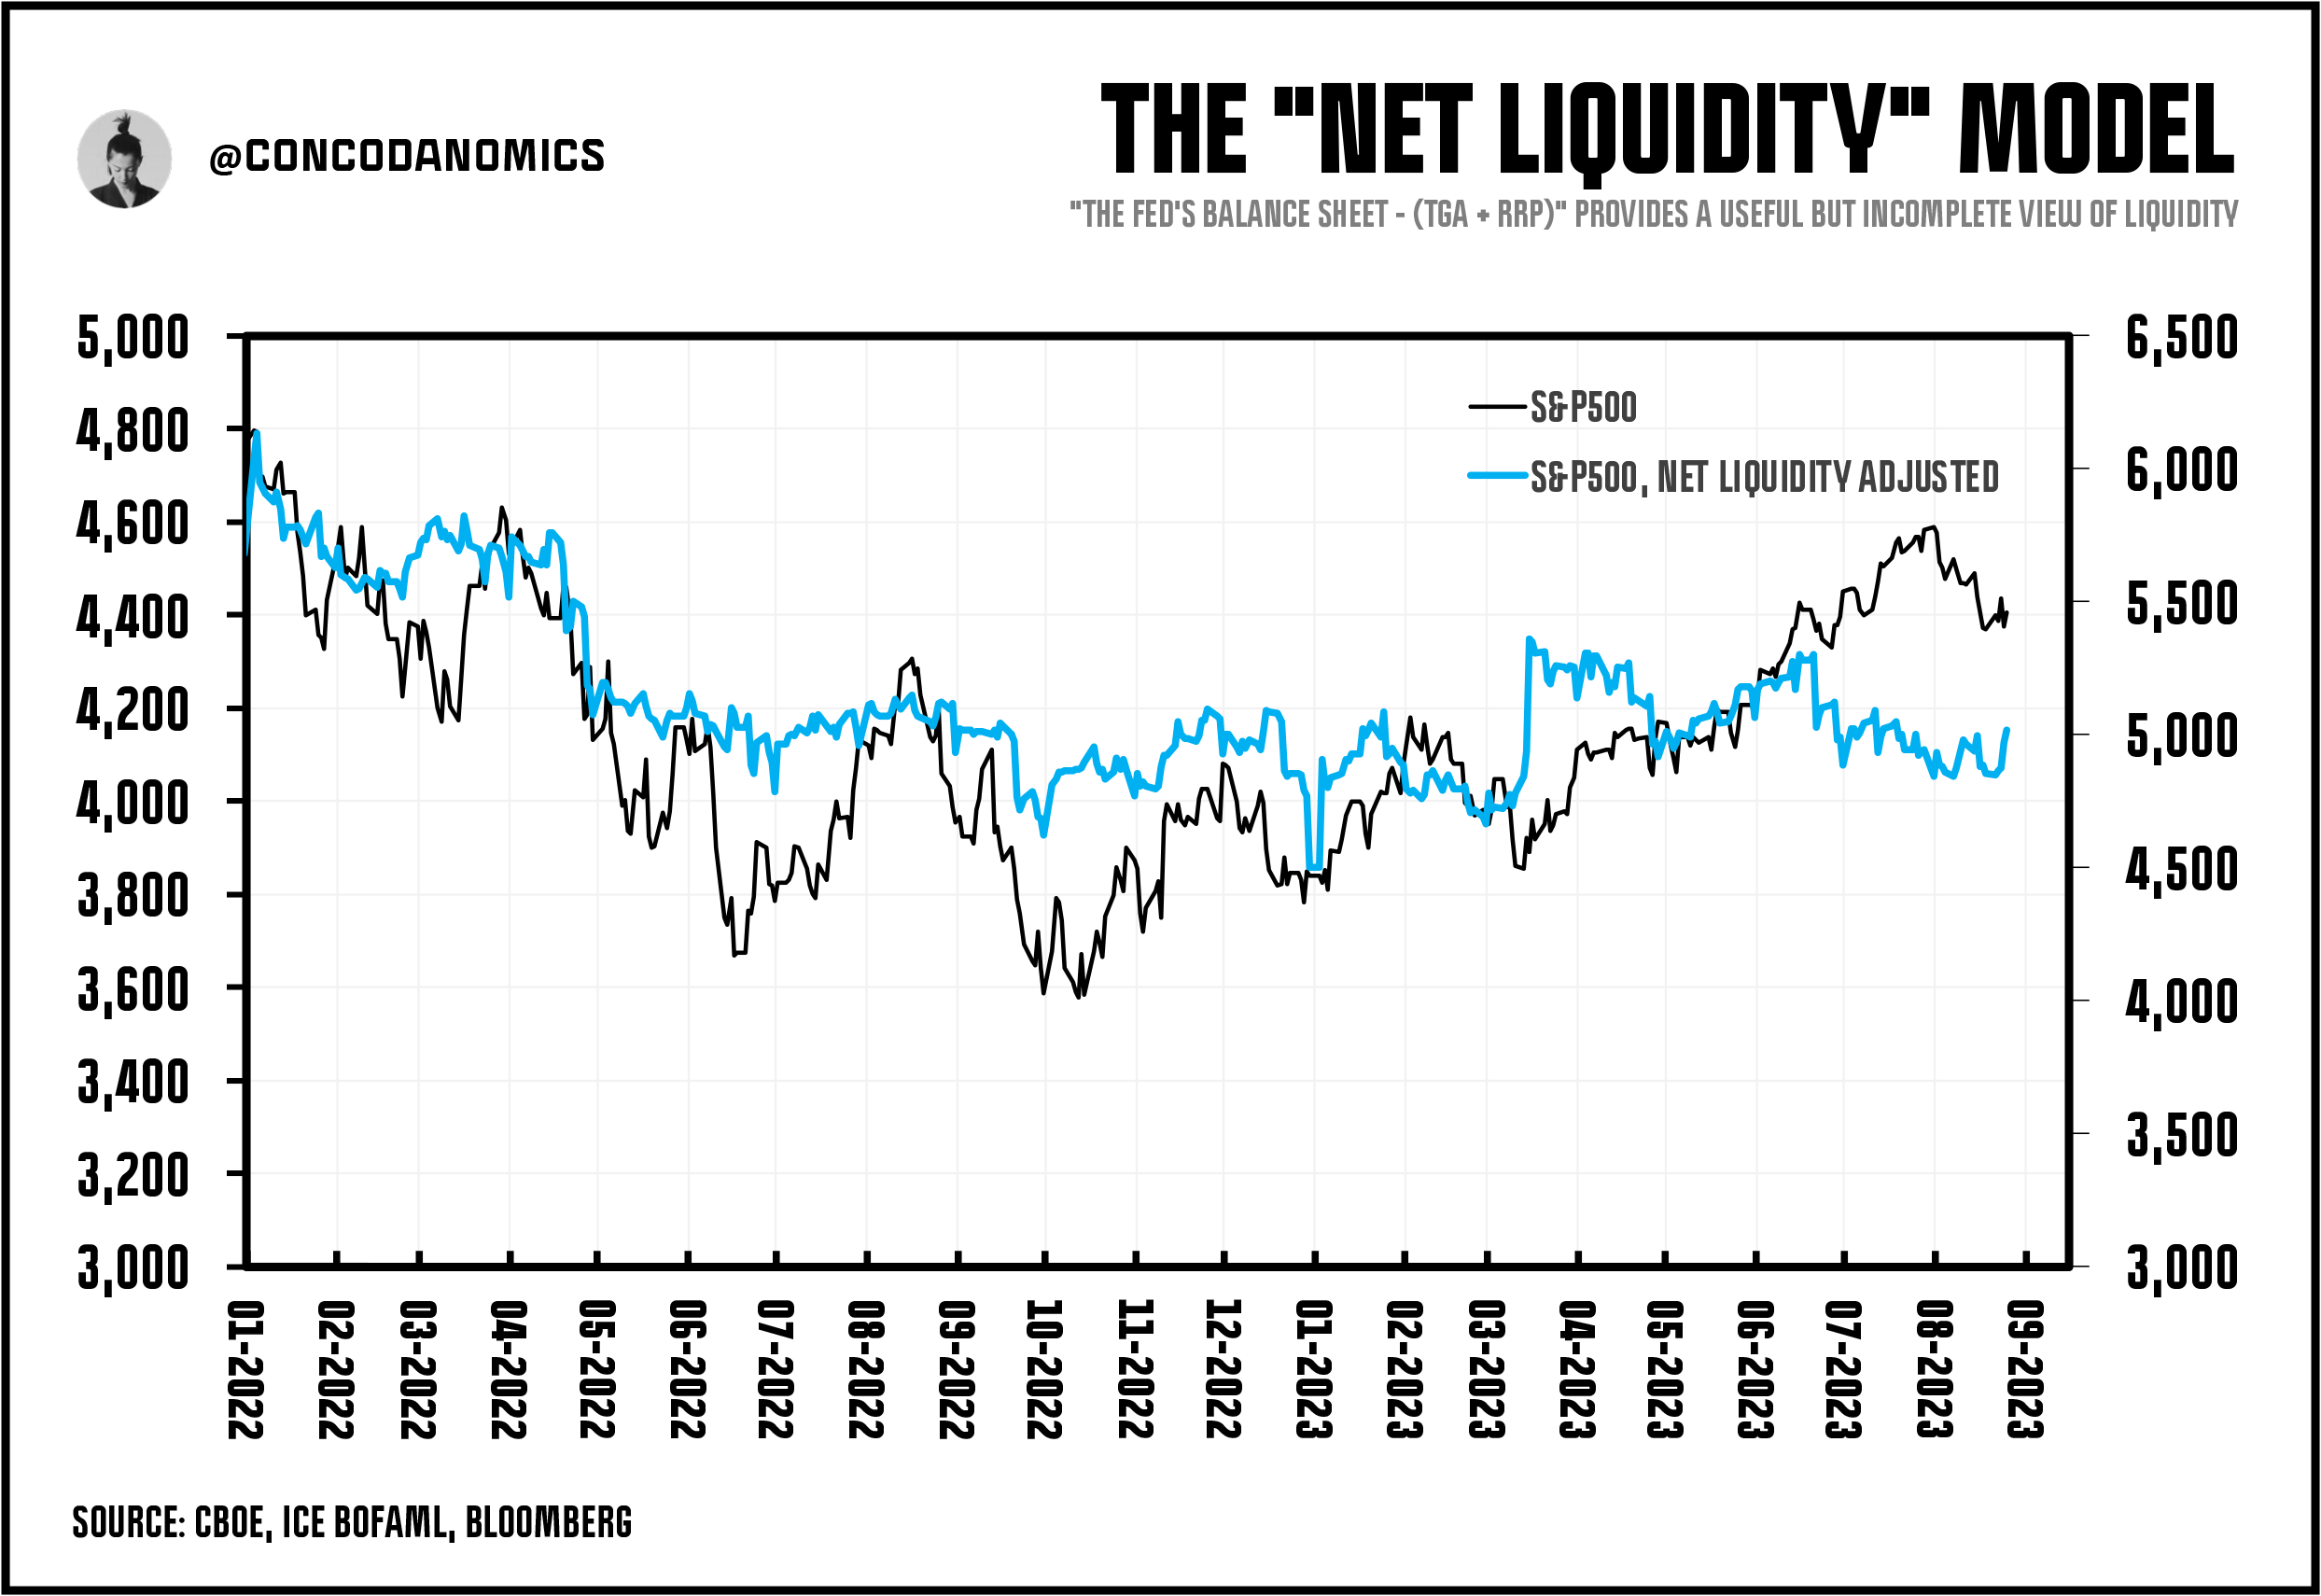
b) In the "Net liquidity model" chart - how is the "S&P500 - Net Liquidity Adjusted" calculated?